Thank you for visiting the Education section of the World web site.

This is default featured slide 1 title

Go to Blogger edit html and find these sentences.Now replace these sentences with your own descriptions.This theme is Bloggerized by Lasantha Bandara - Premiumbloggertemplates.com.

This is default featured slide 2 title

Go to Blogger edit html and find these sentences.Now replace these sentences with your own descriptions.This theme is Bloggerized by Lasantha Bandara - Premiumbloggertemplates.com.

This is default featured slide 3 title

Go to Blogger edit html and find these sentences.Now replace these sentences with your own descriptions.This theme is Bloggerized by Lasantha Bandara - Premiumbloggertemplates.com.

This is default featured slide 4 title

Go to Blogger edit html and find these sentences.Now replace these sentences with your own descriptions.This theme is Bloggerized by Lasantha Bandara - Premiumbloggertemplates.com.

This is default featured slide 5 title

Go to Blogger edit html and find these sentences.Now replace these sentences with your own descriptions.This theme is Bloggerized by Lasantha Bandara - Premiumbloggertemplates.com.

Monday, December 29, 2014

How to Choose Classes


My name is KMHR. I go by Caroline in the States and to
some folks back home too. I’m currently a junior at NYU studying Economics and
Comparative Literature and would like to share some tips on finding classes to
take.


There are many things to consider when taking up new classes for the semester. Here are a few I constantly have to ask myself:

1) What is the class about? Is the subject matter interesting to me/is it intellectually stimulating?

2) Is the professor good at teaching? 


3) How hard is the class? Is the workload heavy? Might this negatively affect my GPA?


4) Will I learn anything practical/technical?

5) Does this fit into my schedule?


Since you get so much freedom to pick and choose your classes AND professors, one needs to be extra careful because a good or bad professor might make a huge difference in your perception of the subject matter. At the same time you might learn a lot from the class but maybe his past students have mentioned that it is a hard class to get an A in. On the
contrary, you might be looking for something to boost your GPA this semester so you might look into something fun and has a relatively lighter workload. Also, some classes like “Intro to Programming” will be more practical to put on your resume than a class like “Renaissance Art” for example. However, you might be very interested in Art History in general, so you may opt to take a class some time down the road if not right now (I did). Lastly, since you are making your
own schedule, YOU need to decide what kind of a schedule fits your lifestyle the best. For example, maybe you are not a morning person and hate 9am classes, so opt for afternoon classes instead then! Or perhaps you want to pursue on-campus jobs/internships while studying, so you want to keep 1 or 2 of your days free for that. 


Making all these decisions can be very time-consuming and frustrating at times, however I personally enjoy doing the research because frankly it's fun to have total control over how you want the next few months of your life to be like!
Share:

Some thoughts from an exam room

So I've been spending time in the wound care clinic and learning about the healing process for bodies and souls...

The majority of the patients who are referred for wound care have diabetes. One common complication of diabetes is neuropathy, which is a nerve disorder that often leads to numbness in hands, arms, feet, and legs. Once a person loses feeling in their hands or feet it is easy for them to injure their bodies without even realizing it. A small blister that might be a painful nuisance for a non-diabetic person can lead to infection and even amputation for a diabetic patient if it is not properly treated. Diabetes is an extremely demanding disease that requires discipline with nutrition, exercise, monitoring of blood sugar, and checking your feet.

I have been amazed and touched by the loving care that the wound care nurse and physician provide for their patients. They patiently listen to the concerns and needs of the patient before they ask them to sit in the exam chair in order to examine their wound. They thoroughly understand the healing process-cutting back calluses and applying ointment and bandages when needed.

Some patients enter the exam room with smiles on their faces, but as one woman stepped through the door her body language and tone of voice seemed to indicate that she was feeling downtrodden. She had been referred to wound care because she had two large blisters on her feet from walking. As she commented about the situation, she said that she was disgusted. I asked her if she was disgusted about the actual blisters on her feet or that she was not able to walk. Tears streamed down her face as she told us, “I’ve been doing everything they have been telling me to do—checking my blood sugar six times a day, walking five days a week to try to lose some weight—but now I can’t even walk because of these blisters. I’m just disgusted because I’m trying so hard but for no use. I’m afraid I am going to start to get depressed over it all.”

I spent some time just listening to her, giving her some space to cry, and responding with some empathy. Then, I shared with her about some of the exercises that I learned about in the Diabetes group meeting that she could do from a chair while her blisters heal. I also got her some information about Diabetes group meetings and a fellowship group that meets once a week to support one another because she felt like talking to some others with similar struggles might help and give her hope. The physician asked me to call around to area pharmacies to try to locate lamb’s wool to prevent further blisters. I was able to find a pharmacy and ask them to hold it at the front for our patient.

This encounter with this disgusted patient has stuck with me. How can we as churches and faith-based community agencies best support and care for patients who are overwhelmed by their diseases? Her situation brings to light the intimate connection between physical, emotional, and spiritual health. Where are calloused places in our lives that need to be cut away in order for us to spiritually heal and provide space for others to heal?
Share:

Sunday, December 28, 2014

Education disparity trends in South Asia

An article on education disparity in South Asia described a newly developed Education Parity Index (EPI). This index combines data on primary school attendance, secondary school attendance and the survival rate to the last grade of primary school, disaggregated by gender, area of residence and household wealth. The value of the EPI has a theoretical range of 0 to 1, where 1 indicates absolute parity.

Through a combination of survey data from several years it is possible to analyze trends in disparity as measured by the EPI. For the trend analysis, data from the following South Asian household surveys - mainly Demographic and Health Surveys (DHS) and Multiple Indicator Cluster Surveys (MICS) - were available.
  • Afghanistan: 2003 MICS
  • Bangladesh: 1999-2000 DHS, 2004 DHS, 2006 DHS
  • India: 1998-99 DHS, 2000 MICS, 2005-06 DHS
  • Nepal: 1996 DHS, 2000 MICS, 2001 DHS, 2006 DHS
  • Pakistan: 2000-01 survey, 2006-07 DHS
The graph below plots the EPI values calculated from each survey. Due to a lack of data, no trends can be shown for Afghanistan.

Education disparity trends in South Asia, 1996-2007
Trend lines with Education Parity Index values between 1996 and 2007
Data source: Demographic and Health Surveys (DHS), Multiple Indicator Cluster Surveys (MICS), 1996-2007.

In Bangladesh, India and Nepal, the EPI has increased from the earliest to the latest year with data, indicating a decrease in disparity over the period of observation. In Bangladesh, the EPI grew from 0.79 in 2000 to 0.84 in 2006. In India, the EPI was at 0.77 in 1999 and 0.82 in 2006. In Nepal, the EPI shows the biggest increase, from 0.67 in 1996 to 0.83 in 2006, interrupted by a decrease from 2000 to 2001. Compared to the other countries, Nepal has thus made the most progress toward parity in the education system.

For Pakistan, the EPI has decreased from 2000 to 2007, indicating an increase in disparity. However, an inspection of the underlying data reveals that the earlier survey did not provide data on household wealth. Disparities related to wealth are usually greater than disparities related to gender or area of residence. If data on wealth had been available, the EPI for 2000 would most likely have been lower. The data from the 2006-07 DHS confirm this assumption. Children from the poorest quintile have much lower attendance and survival rates than children from the richest quintile, and the disparity between these two groups of children is much greater than the disparity between boys and girls and between children from urban and rural households. For example, the primary school net attendance rate (NAR) in Pakistan is 46 percent among children from the poorest household quintile but twice as high, 93 percent, among children from the richest quintile. In comparison, the primary NAR is 76 percent for boys, 67 percent for girls, 82 percent for urban children, and 67 percent for rural children according to the 2006-07 DHS.

The data gaps in the graph bring to attention one limitation of the EPI. The net enrollment rate and other data published annually by UNESCO in the Global Education Digest or the Education For All Global Monitoring Report are not disaggregated beyond gender and can therefore not be used to calculate the EPI. On the other hand, national household survey data, which permit the required level of disaggregation, are not collected every year but only every four or five years, on average.
Share:

School attendance in Brazil

Brazil is the largest and most populous country in South America. The Brazilian Institute of Geography and Statistics (IBGE) estimates that the population of Brazil grew to 190 million in 2008. The World Bank ranks Brazil as the world's tenth largest economy with a gross domestic product (GDP) of $1.3 trillion in 2007.

Brazil has achieved high levels of school attendance and literacy. The UNESCO Institute for Statistics (UIS) estimates that 94 percent of all children of primary school age were enrolled in primary school in 2005, the latest year with data. The youth literacy rate, for persons aged 15 to 24 years, was 99 percent in 2007 according to the UIS. Among the adult population aged 15 years and older, 91 percent were literate in 2007. In contrast, in 1980 only 75 percent of the adult population of Brazil could read and write.

The patterns of school attendance in Brazil can be studied in greater detail with data from the 2006 National Household Sample Survey (Pesquisa Nacional por Amostra de Domicílios, PNAD). The survey collected data on current and past school attendance for all household members, regardless of age. For the analysis that follows, the levels of education in the PNAD data were recoded to match the International Standard Classification of Education (ISCED) of 1997. Five levels of education are identified:
  • Pre-primary education
  • Primary education
  • Secondary education
  • Tertiary education
  • Adult literacy programs
Adult literacy programs are not part of the ISCED classification but they play an important role in Brazil and are therefore included as a separate group. The graph below illustrates current school attendance by age and level of education for the population aged 0 to 30 years. The number at the top of each bar is the percent of persons of a particular age that are currently in school. For example, 97 percent of all 7-year-olds were in school at the time of the survey; the majority attended primary school but more than 10 percent of all 7-year-olds were still in preschool.

The official school ages in Brazil are indicated along the horizontal axis. The official entrance age for pre-primary education is 4 years, primary education begins at 7 years, and secondary education at 11 years. Education is compulsory for all children aged 7 to 14 years.

Brazil: Current school attendance by age and level of education, 2006
Level of education attended for persons 0 to 30 years, Brazil 2006
Data source: Brazil National Household Sample Survey (PNAD), 2006.

The PNAD data show that many young children in Brazil attend pre-primary education. Two thirds of all children between 4 and 6 years are in preschool or day care. The laws on compulsory education have the desired effect and almost all children between 7 and 14 years are in fact in school. The attendance rates in this age group range from 94 percent among 14-year-olds to 99 percent among 8- to 11-year-olds. Among children of secondary school age, the attendance rate drops steadily from 99 percent at age 11 to 74 percent at age 17. About 8 percent of 18-year-olds are in tertiary education. University attendance rates reach a peak of 15 percent among 20- to 22-year-olds.

Overage school attendance is relatively common in Brazil and many children older than 10 years are still in primary school. Persons up to and beyond age 30 attend secondary education. These high levels of primary and secondary school attendance among the older population are partly a result of a system of education that offers persons who dropped out of school an opportunity to continue their education later in life. Adult literacy programs reach a relatively small part of the population but they contribute to the high level of literacy in Brazil. About 0.5 to 1 percent of the population between 30 and 75 years participate in programs that teach reading and writing.

Data sources
Share:

Teacher and Student ratio in secondary school

The pupil/teacher ratio is an indicator of education quality. In crowded classrooms with a high number of pupils per teacher the quality of education suffers. For pupils it is difficult to follow the course and teachers can dedicate less time to the needs of each individual student. Data from UNESCO on the pupil/teacher ratio in primary school show that crowded classrooms are more common in Sub-Saharan Africa and Southern Asia than in other parts of the world. 22 of the 27 countries with 40 or more pupils per primary school teacher are located in Sub-Saharan Africa.

In secondary school, pupil/teacher ratios are lower than in primary school. The Data Centre of the UNESCO Institute for Statistics provides the pupil/teacher ratio in secondary school for 189 countries and territories. For 100 countries, the pupil/teacher ratios are from 2006, 9 countries have data from 2007, 51 countries have data from 2004 or 2005, and the remaining 29 countries have data from 1999 to 2003. For the map below, all countries with data were divided into five groups:
  • Fewer than 10 pupils per teacher: 24 countries
  • 10 to 19 pupils per teacher: 107 countries
  • 20 to 29 pupils per teacher: 41 countries
  • 30 to 39 pupils per teacher: 13 countries
  • 40 or more pupils per teacher: 4 countries
Pupil/teacher ratio in secondary school, circa 2006
Map of the world showing national pupil/teacher ratios in secondary school
Data source: UNESCO Institute for Statistics, Data Centre, May 2008.

The lowest pupil/teacher ratios in secondary school were reported for Bermuda (6.0), Tokelau (7.0), Portugal (7.1), and Andorra (7.8). 20 additional countries have pupil/teacher ratios above 8 and below 10: Armenia, Azerbaijan, Belarus, British Virgin Islands, Cayman Islands, Croatia, Georgia, Greece, Kuwait, Lebanon, Liechtenstein, Lithuania, Malta, Monaco, Niue, Norway, Qatar, Russia, Sweden, and Turks and Caicos Islands.

More than half of all countries - including most countries in North and South America, Europe, the Middle East, and East Asia - have pupil/teacher ratios between 10 and 19. The group also includes some countries in other regions. Although pupil/teacher ratios in Sub-Saharan Africa are generally higher than in other parts of the world, the following countries from the region have only 10 to 19 pupils per secondary school teacher: Angola, Botswana, Burundi, Cameroon, Cape Verde, Comoros, Democratic Republic of Congo, Ghana, Guinea-Bissau, Mauritius, Seychelles, and Swaziland. 22 of the 41 countries with pupil/teacher ratios between 20 and 29 are also located in Sub-Saharan Africa.

17 countries have 30 or more pupils per teacher in secondary school and 10 of these countries are in Sub-Saharan Africa. The countries with 30 to 39 pupils per teacher are Chad, Congo, Djibouti, Honduras, India, Kenya, Mozambique, Myanmar, Nepal, Nicaragua, Philippines, South Africa, and Zambia. Classes at the secondary level of education are most crowded in Nigeria (pupil/teacher ratio 40.2), Pakistan (41.9), Malawi (45.6), and Eritrea (54.4).

The following table lists the average pupil/teacher ratio in secondary school by Millennium Development Goal region. The Commonwealth of Independent States (10.9), the developed countries (11.4), Oceania (14.8), Western Asia (15.3), Latin America and the Caribbean (16.6), Eastern Asia (19.0), and Northern Africa (19.0) have average pupil/teacher ratios below 20. Pupil/teacher ratios are highest in South-Eastern Asia (22.8), Sub-Saharan Africa (25.8), and Southern Asia (26.4). The global average is 18.0 pupils per teacher in secondary school. These average values are unweighted, which means that each country is given the same weight within its region, regardless of the size of its population.

Average pupil/teacher ratio in secondary school by MDG region, circa 2006
MDG region Pupil/teacher ratio
Developed countries 11.4
Commonwealth of Independent States 10.9
Eastern Asia 19.0
South-Eastern Asia 22.8
Oceania 14.8
Southern Asia 26.4
Western Asia 15.3
Northern Africa 19.0
Sub-Saharan Africa 25.8
Latin America and the Caribbean 16.6
World 18.0
Data source: UNESCO Institute for Statistics, Data Centre, May 2008. Regional and global averages are unweighted.

The data analyzed in this article can be downloaded from the UNESCO Institute for Statistics Data Centre, under Predefined Tables - Education - Table 11: Indicators on teaching staff at ISCED levels 0 to 3.
Share:

Global Education Digest 2008

Cover of the Global Education Digest 2008The UNESCO Institute for Statistics (UIS) has announced the publication of the Global Education Digest 2008: Comparing Education Statistics Across the World. This annual publication contains detailed statistical tables with the latest UIS data on pre-primary, primary, secondary and tertiary education, education finance and literacy.
The introductory chapters in the this year's edition of the Digest discuss the data collection process at UIS, the International Standard Classification of Education (ISCED) and differences between national and international education data, the use of historical time series to track educational trends, and programs of cooperation between UIS and the Organisation for Economic Co-operation and Development (OECD) and the Statistical Office of the European Communities (Eurostat).

The Global Education Digest 2008 contains several tables that were not available in the 2007 edition. New tables with time series data provide statistics for more than 200 countries and territories from 1970, 1980, 1990, 2000 and 2005 for the following indicators: primary and secondary school age; population of secondary school age (the population of primary school age is available at the UIS Data Centre, see below); enrollment in primary, secondary and post-secondary education; total enrollment from primary to tertiary education; primary and secondary school gross enrollment ratio (GER); primary school gross intake ratio; gross intake ratio to the last grade of primary school (a proxy indicator for the primary completion rate); repetition rate in primary and secondary school; school life expectancy (primary to secondary and primary to tertiary); pupil/teacher ratio in primary and secondary school; and public expenditure on education.

A further addition in the new publication is a set of tables with data for 62 UOE and WEI countries. UOE refers to a joint data collection program by UIS, OECD and Eurostat in high- and middle-income countries. WEI stands for World Education Indicators, a UIS program for middle-income countries. The participating countries are listed on pages 30 and 31 of the Global Education Digest 2008.

The data from the tables in the Global Education Digest can be downloaded from the UIS Data Centre (click on "Predefined Tables" and then "Education"). The time series data for the years 1970 to 2005 are available in Excel format in Tables 21 to 23. The population of primary school age between 1970 and 2005 is not shown in the printed report but included in Table 21. In addition, the Data Centre offers annual data for the years 1999 to 2008, while the Digest only shows data for one or two years, depending on the indicator.

References
  • UNESCO Institute for Statistics (UIS). 2008. Global education digest 2008: Comparing education statistics across the world. Montreal: UIS. (Download PDF, 7.3 MB)
  • UNESCO Institute for Statistics (UIS). 2007. Global education digest 2007: Comparing education statistics across the world. Montreal: UIS. (Download PDF, 3.7 MB)
Share:

Primary school attendance by state in India

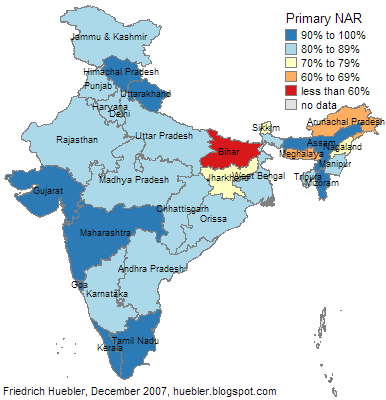
The average primary school net attendance rate in India is 83 percent according to data from a Demographic and Health Survey (DHS) conducted in 2005 and 2006. However, the national average hides considerable regional variation in primary school attendance. India is divided into 28 states and 7 union territories. With the DHS data it is possible to calculate the primary school NAR in 29 states and territories, shown in the map and table below.

Primary school attendance in India by state and territory, 2006
Map showing primary school attendance in India by state and territory, 2006
Data source: India DHS 2005-06

The states with the highest primary school net attendance rates, between 98 and 99 percent, are Himachal Pradesh, Kerala, and Tamil Nadu. In these states, virtually all children of primary school age are in school. Six other states also have primary NAR values above 90 percent: Assam, Goa, Gujarat, Maharashtra, Mizoram, and Uttarakhand. In fifteen states and territories the primary NAR is between 80 and 90 percent.

In six states, fewer than four out of five children of primary school age are in school: Arunachal Pradesh, Bihar, Jharkhand, Meghalaya, Nagaland, and Sikkim. By far the lowest primary school attendance rates are observed in Bihar (59 percent) and Meghalaya (60 percent), two of the poorest and economically least developed states of India.

Primary school attendance in India by state and territory, 2006
State or Territory Primary NAR (%) State or Territory Primary NAR (%)
Andaman and Nicobar Islands - Lakshadweep -
Andhra Pradesh 89.2 Madhya Pradesh 81.0
Arunachal Pradesh 67.3 Maharashtra 91.7
Assam 91.1 Manipur 80.3
Bihar 58.5 Meghalaya 60.4
Chandigarh - Mizoram 91.8
Chhattisgarh 86.5 Nagaland 71.9
Dadra and Nagar Haveli - Orissa 86.8
Daman and Diu - Puducherry -
Delhi 89.9 Punjab 89.1
Goa 94.1 Rajasthan 81.0
Gujarat 91.1 Sikkim 77.6
Haryana 87.6 Tamil Nadu 98.5
Himachal Pradesh 97.8 Tripura 89.6
Jammu and Kashmir 86.7 Uttar Pradesh 81.4
Jharkhand 72.1 Uttarakhand 93.4
Karnataka 88.5 West Bengal 85.1
Kerala 98.1 India 83.3
Data source: India DHS 2005-06
Share:

UNICEF statistical review: Progress for Children

Cover of "Progress for Children: A World Fit for Children Statistical Review" by UNICEFOn 10 December 2007, UNICEF launched a new publication, Progress for Children: A World Fit for Children Statistical Review. With more than 60 pages of graphs and tables, the report draws a detailed statistical picture of the current state of the world's children. The publication is divided into sections organized by Millennium Development Goal.
  • MDG 1: Eradicate extreme poverty and hunger
  • MDG 2: Achieve universal primary education
  • MDG 3: Promote gender equality and empower women
  • MDG 4: Reduce child mortality
  • MDG 5: Improve maternal health
  • MDG 6: Combat HIV and AIDS, malaria and other diseases
  • MDG 7: Ensure environmental sustainability
An additional section has data on protection against abuse, exploitation, and violence.

Some findings of the report in the area of education are:
  • The number of children out of school has fallen from 115 million in 2002 to 93 million in 2005-2006.
  • More than three quarters of all children out of school worldwide live in Sub-Saharan Africa and South Asia.
  • Secondary school net attendance or enrollment rates are below 50 percent in many countries, including most of Africa.
  • Almost all countries in North and South America, Europe, Central Asia, and East Asia have reached the goal of gender parity in primary education.
  • Few countries have reached gender parity in secondary education.
  • Child labor, which interferes with education, is most prevalent in Sub-Saharan Africa.
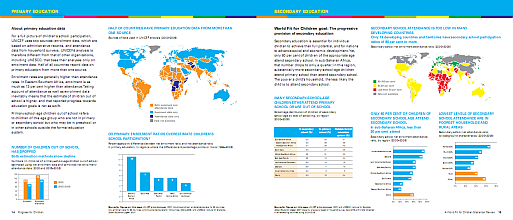
Excerpt from Progress for Children: Data on primary and secondary education
Excerpt from "Progress for Children" by UNICEF: data on primary and secondary education
Source: UNICEF 2007: p. 14-15.

References
  • UNICEF. 2007. Progress for Children: A World Fit for Children Statistical Review. New York: UNICEF. (Download in PDF format, 3.6 MB)
Share:

Population structure and children out of school

Sub-Saharan Africa is the region with the highest percentage of children out of school. At the same time, the population of most countries in Sub-Saharan Africa is increasing and children of primary school age constitute a large and growing share of the population.

The link between the population structure and the number of children out of school is shown in the figures and table below. Data on the share of children of primary school age out of school were obtained from the Childinfo website of UNICEF. The official primary school ages in individual countries from the Data Centre of the UNESCO Institute for Statistics were combined with demographic data from the UN Population Division to calculate the share of children of primary school age in each country's population. In total, data for 177 countries were available. All values are for the year 2007.

In Figure 1, the population of primary school age as a percentage of the total population is plotted along the horizontal axis. At the lower end of the scale are Belarus, Bulgaria, Germany, Latvia, Russia, and Ukraine. In these countries, children of primary school age account for less than 4 percent of the total population. The countries with the highest share of children of primary school age are located in Sub-Saharan Africa: Uganda (21 percent), Zambia (20 percent), Lesotho, Mozambique, Somalia (19 percent), Malawi, Swaziland, and Tanzania (18 percent).

The share of children out of school is plotted along the vertical axis. For five countries, the available statistics indicate that less than 0.5 percent of children are out of school: Japan, Malaysia, Spain, Uruguay, and Uzbekistan. In eight countries, half or more of all children are not in school: Somalia (77 percent), Chad (64 percent), Niger (62 percent), Liberia (61 percent), Ethiopia (55 percent), Eritrea (54 percent), Burkina Faso (53 percent), and Haiti (50 percent). Except for Haiti and Pakistan, the 20 countries with the highest share of children out of school are located in Sub-Saharan Africa.

The color of the marker for each country in Figure 1 indicates the geographic region according to the grouping used for the UN Millennium Development Goals (MDG). The size of each marker indicates the absolute size of the population of primary school age. The big red circle is the marker for India and the big green circle is the marker for China. Other countries with a large number of children of primary school age are Indonesia in South-Eastern Asia, USA in the developed countries, and Nigeria in Sub-Saharan Africa.

The distribution of the points in Figure 1 shows that countries with a small share of children of primary school age in the total population also tend to have a small percentage of children out of school. By contrast, countries with a relatively large population of primary school age also have a higher percentage of children out of school. This positive correlation between the two variables is confirmed by a linear regression of the percent of children out of school on the percent of children of primary school age and the squared percent of children of primary school age. The predicted share of children out of school is indicated by the dark gray line. The light gray band around the prediction line indicates the 95 percent confidence interval.

Figure 1: Population of primary school age and children out of school by country, 2007
Scatter plot with country data on the share of children of primary school age and the share of children out of school in 2007
Note: Marker size indicates the number of children of primary school age in a country.
Data source: UNESCO Institute for Statistics, UNICEF, UN Population Division.

For Figure 2, the data from the 177 countries in Figure 1 were combined by MDG region. The share of children of primary school age in a region's population is plotted along the horizontal axis and the share of children out of school along the vertical axis. The colors of the markers are the same as in Figure 1. The regional values, summarized in Table 1, reflect the 177 countries for which data were available.

Figure 2: Population of primary school age and children out of school by MDG region, 2007
Scatter plot with regional data on the share of children of primary school age and the share of children out of school in 2007
Note: Marker size indicates the number of children of primary school age in a region.
Data source: UNESCO Institute for Statistics, UNICEF, UN Population Division.

At the global level, about 10 percent of the population are of primary school age. The regional values range from 4.6 percent in the Commonwealth of Independent States to 16.5 percent in Sub-Saharan Africa. The average share of children out of school across the 177 countries with data is 15.5 percent. In six regions, fewer than 10 percent of all children are out of school: Commonwealth of Independent States, developed countries, Eastern Asia, Latin America and the Caribbean, Northern Africa, and South-Eastern Asia. Sub-Saharan Africa has by far the highest share of children out of school, with 36.2 percent, followed by Southern Asia with 20 percent and Oceania with 17.1 percent.

Table 1: Population of primary school age and children out of school by MDG region, 2007
MDG region Population of primary school age as share of total population (%) Children of primary school age out of school (%)
Developed countries 6.4 4.6
Commonwealth of Independent States 4.6 6.8
Eastern Asia 7.1 0.8
South-Eastern Asia 10.8 6.5
Oceania 14.5 17.1
Southern Asia 10.8 20.0
Western Asia 12.5 12.5
Northern Africa 11.9 5.9
Sub-Saharan Africa 16.5 36.2
Latin America and the Caribbean 10.3 7.2
World 9.8 15.5
Data source: UNESCO Institute for Statistics, UNICEF, UN Population Division.

Due to their current population structure and demographic trends, countries in Sub-Saharan Africa have to provide schools and teachers for a relatively larger number of children than countries in other regions. The Millennium Development Goal of universal primary education by 2015 is therefore more difficult to meet for countries in Sub-Saharan Africa than for countries with a relatively small and constant or shrinking population of primary school age.

Data sources
Share:

Universal primary education by 2015: A goal out of reach?

The new UNICEF publication Progress for Children compares data on children out of school by UNESCO and UNICEF. According to UNESCO, 72 million children of primary school age were out of school in 2005, down from 96 million in 1999. UNICEF estimates that 93 million children were out of school in 2005/2006, down from 115 million in 2002. Although both sets of data show a decline in the number of children out of school, they also indicate that the Millennium Development Goal of universal primary education by 2015 may be out of reach.

The graph below plots trend data on the number of children out of school calculated by UNESCO for the period 1999-2005 and by UNICEF for the period 2002-2006. (The 2002 estimate in the latter trend line is based on joint work by UNICEF and the UNESCO Institute for Statistics.) If we assume that the reduction in the number of children out of school continues at the same average rate as over the past years, more than 30 to 40 million children will still be out of school by 2015 and the international community will have failed in its efforts to secure primary education for all children.

Children out of school, 1999-2015
Graph with trend data on number of children out of school, 1999-2015
Data sources: UIS (2005), UNESCO (2007), UNICEF (2007).

References
  • UNESCO Institute for Statistics (UIS). 2005. Children out of school: Measuring exclusion from primary education. Montreal: UIS. (Download in PDF format, 4.9 MB)
  • UNESCO. 2007. Education for all by 2015: Will we make it? - EFA global monitoring report 2008. Paris: UNESCO. (Download in PDF format, 11.8 MB)
  • UNICEF. 2007. Progress for Children: A World Fit for Children Statistical Review. New York: UNICEF. (Download in PDF format, 3.6 MB)
Share:

Global population of primary school age, 2000-2015

The second UN Millennium Development Goal (MDG) is the achievement of universal primary education by the year 2015. Since 2000, many countries have come closer to this goal, but at the current rate of progress it is likely that the goal will be missed when the year 2015 arrives.

To ensure that all children attend and complete primary school, countries have to provide enough schools, teachers, and training materials. Future demographic trends are one factor that has to be taken into consideration to plan for the education system. The UN Population Division provides population projections that can be combined with data on national primary school ages from the UNESCO Institute for Statistics to calculate national and regional trends in the population of primary school age.

The graph and table below depict the population trends by MDG region. At the global level, the number of children of primary school age is projected to increase from 655 million in 2000 to 668 million in 2015. In some regions, the population of primary school age is expected to shrink, while other regions experience a population increase.

Population of primary school age, 2000-2015
Graph with population of primary school age from 2000 to 2015
Data sources: (1) Population: UN Population Division, World Population Prospects 2006. (2) Primary school ages: UNESCO Institute for Statistics, Data Centre.

Two regions with very different trends stand out. In Sub-Saharan Africa, the number of children of primary school age is estimated to grow by 37 percent or 41 million children over the period 2000 to 2015. Countries in this region not only have to provide schools and teachers for all children that have been born so far, they have to increase the capacity of the education system further to accommodate the rapidly growing population. Even wealthy countries with a well-developed education infrastructure would struggle if they had to expand the capacity of their education system by more than one third over a period of 15 years.

In contrast, the population of primary school age in Eastern Asia is expected to drop by 25 percent or 29 million between 2000 and 2015, easing the pressure on the education system. Other regions with a projected decrease in the population of primary school age are the Commonwealth of Independent States and the developed countries. In Latin America and the Caribbean and in South-Eastern Asia, the population is expected to be virtually unchanged.

In Western Asia, Southern Asia, Oceania, and Northern Africa, the projections also show an increase in the population of primary school age, but at a lower relative and absolute level than Sub-Saharan Africa. Countries in the former regions therefore face fewer demographic obstacles on the path to universal primary education than countries in Sub-Saharan Africa.

Population of primary school age, 2000-2015 Data sources: (1) Population: UN Population Division, World Population Prospects 2006. (2) Primary school ages: UNESCO Institute for Statistics, Data Centre.

References
Region Population of primary school age (million) Change 2000-2015
2000 2015 Million Percent
Oceania 1.1 1.3 0.2 22.8
Commonwealth of Independent States 15.1 12.3 -2.9 -19.0
Northern Africa 19.7 20.0 0.3 1.8
Western Asia 23.9 27.2 3.2 13.5
Latin America and the Caribbean 58.1 57.7 -0.4 -0.7
South-Eastern Asia 63.4 62.9 -0.5 -0.8
Developed countries 67.8 65.0 -2.8 -4.2
Sub-Saharan Africa 111.4 152.5 41.1 36.9
Eastern Asia 117.3 88.2 -29.1 -24.8
Southern Asia 177.0 181.2 4.2 2.4
World 654.9 668.3 13.4 2.0
Share:

Children of primary and secondary school age out of school

The UNESCO Institute for Statistics (UIS) publishes annual estimates of the number of children of primary school age out of school. A recent paper by Michael Bruneforth and Peter Wallet, Out-of-school adolescents (UIS 2010), extends the analysis to children of lower secondary school age. Any child enrolled in primary, secondary or tertiary education is considered in school, regardless of the child's age. Only children that are truly excluded from education are counted as out of school.

The paper's regional and global estimates of the number and percent of children out of school are reproduced in this article. Table 1 lists the population of primary and lower secondary school age in 2007. Worldwide there were about 653 million children of primary school age and 388 million children of lower secondary school age. More than half of these children lived in South and West Asia and East Asia and the Pacific.

Table 1: Population of primary and lower secondary school age by region (million), 2007
Region Primary Lower secondary Total
Sub-Saharan Africa 124.9 57.9 182.7
Arab States 41.4 21.9 63.5
South and West Asia 176.8 106.8 284.2
Central Asia 5.6 8.0 13.8
East Asia and the Pacific 173.8 106.5 281.2
Central and Eastern Europe 22.2 20.3 42.1
North America and Western Europe 50.8 31.0 81.6
Latin America and the Caribbean 58.6 35.9 93.7
World 652.6 388.2 1042.5
Source: UIS 2010, page 10, Table 1; author's calculations. - Note: Figures may not sum due to rounding.

Figure 1 illustrates the regional distribution of the population of primary and lower secondary school age. The number of children in these age groups is plotted along the horizontal axis. The vertical axis indicates the share of children of primary and lower secondary school age in each region. The regions with the largest number of school-age children in 2007 were South and West Asia (284 million), East Asia and the Pacific (281 million), and Sub-Saharan Africa (183 million). More than 60 percent of the combined population of primary and lower secondary school age were of primary school age. Central Asia and Central and Eastern Europe were exceptions, with a greater share of children of lower secondary school age than in other regions. The large share of primary-age children in Sub-Saharan Africa is a symptom of its high population growth rate.

Figure 1: Population of primary and lower secondary school age by region, 2007
Spine plot showing the distribution of the population of primary and lower secondary school age by region in 2007
Source: UIS 2010, page 10, Table 1; author's calculations. - CEE: Central and Eastern Europe, NAWE: North America and Western Europe, LAC: Latin America and the Caribbean.

The share and number of children out of school are listed in Table 2. At the global level, 11 percent or 72 million of all children of primary school age and 18 percent or 71 million of all children of lower secondary school age were out of school. The combined global share of children out of school was 14 percent. Out-of-school rates were highest in Sub-Saharan Africa, where 26 percent of all primary school-age children and 37 percent of all secondary school-age children were excluded from education.

Table 2: Children of primary and lower secondary school age out of school by region, 2007
Region Primary Lower secondary Total
Percent Million Percent Million Percent Million
Sub-Saharan Africa 25.8 32.2 36.8 21.3 29.3 53.5
Arab States 13.9 5.8 19.5 4.3 15.8 10.0
South and West Asia 10.2 18.0 27.3 29.1 16.6 47.2
Central Asia 4.8 0.3 4.9 0.4 4.8 0.7
East Asia and the Pacific 5.2 9.0 10.0 10.6 7.0 19.7
Central and Eastern Europe 7.0 1.6 9.6 1.9 8.3 3.5
North America and Western Europe 3.8 1.9 4.3 1.3 4.0 3.3
Latin America and the Caribbean 5.1 3.0 5.5 2.0 5.3 5.0
World 11.0 71.8 18.3 71.0 13.7 142.8
Source: UIS 2010, page 10, Table 1.

As illustrated in Figure 2, out-of-school rates are always higher at the secondary level of education than at the primary level. This is not surprising because not all students complete primary education and not all of those who graduate from primary school transfer to secondary school to continue their education. In addition to Sub-Saharan Africa, South and West Asia (27 percent) and the Arab States (20 percent) also had a high share of children of secondary school age out of school.

Figure 2: Children of primary and lower secondary school age out of school by region, 2007
Bar chart showing the share of children of primary and lower secondary school age out of school by region in 2007
Source: UIS 2010, page 10, Table 1.

The distribution of children out of school by region in 2007 is shown in Figure 3. A comparison with the population distribution in Figure 1 makes clear that children from Sub-Saharan Africa and South and West Asia were disproportionately more likely to be out of school than children from other regions. More than two thirds of the 143 million out-of-school children of primary and lower secondary age were from Sub-Saharan Africa (54 million) and South and West Asia (47 million). 20 million children out of school lived in East Asia and 10 million in the Arab States. The remaining 13 million children out of school were from Latin America and the Caribbean (5 million), Central and Eastern Europe (3.5 million), North America and Western Europe (3.3 million), and Central Asia (0.7 million).

Figure 3: Children of primary and lower secondary school age out of school by region, 2007
Spine plot showing the distribution of children of primary and lower secondary school age out of school by region in 2007
Source: UIS 2010, page 10, Table 1. - CEE: Central and Eastern Europe, NAWE: North America and Western Europe, LAC: Latin America and the Caribbean.

In Sub-Saharan Africa, the Arab States, North America and Western Europe, and Latin America and the Caribbean most children out of school were of primary age. In South and West Asia, East Asia, and Central and Eastern Europe most children out of school were of lower secondary age. At the global level, the number of out-of-school children of primary school age and lower secondary school age was roughly equal
Share:

61 million out-of-school children in 2010

61 million children of primary school age were out of school in 2010, down from a high of over 110 million out-of-school children in the mid-1990s, according to new estimates by the UNESCO Institute for Statistics (UIS). 32 million or 53% of the 61 million out-of-school children were girls. 

The trend in out-of-school numbers since 1990 is illustrated in Figure 1. Much of the global progress over the past 15 years is due to developments in South and West Asia, where the number of out-of-school children fell from a high of 41 million in 1998 to 13 million in 2010.
Progress in sub-Saharan Africa, another region with a historically large number of out-of-school children, has been much more modest, by comparison. Here, the number of children out of school decreased from a high of 43 million in 1996 to 31 million in 2010. As a result, sub-Saharan Africa today is home to half of all out-of-school children worldwide.
In relative terms, the global out-of-school rate fell from 18% in the early 1990s to 9% in 2010, in spite of a large increase in the number of children of primary school age over the same period. However, the estimates by UIS also show that the out-of-school rate and the number of out-of-school children have stagnated over the past three years, partly because sub-Saharan Africa is struggling to increase enrolment rates in primary education while being confronted with continued strong population growth. At this rate, the world is unlikely to reach the Millennium Development Goal and Education for All goal of universal primary education by 2015.
Figure 1: Global number of out-of-school children of primary school age, by region and sex, 1990-2010

Global number of children out of school from 1990 to 2010

Source: UNESCO Institute for Statistics, July 2012. - Click image to enlarge.

The regional distribution of children in and out of school is illustrated in Figure 2. The width of each region in the graph indicates the size of the population of primary school age. The height of the bars indicates which proportion of children in each region is in or out of school.
In absolute terms, Sub-Saharan Africa has the highest number of children out of school (31 million), although its primary school-age population (132 million) is smaller than that of two other regions: South and West Asia, and East Asia and the Pacific. In relative terms, Sub-Saharan Africa also has the highest out-of-school rate of all regions. 23% of all primary school-age children have either never attended school or left school without completing primary education.
In South and West Asia, the proportion of out-of-school children (8%) is smaller than in sub-Saharan Africa and the Arab States, but in absolute terms, the region is home to 13 million out-of-school children, second only to sub-Saharan Africa. More than half of all out-of-school children in South and West Asia live in only two countries: India (2.3 million) and Pakistan (5.1 million).
East Asia and the Pacific has 168 million children of primary school age, nearly as many as South and West Asia, but only 4% are out of school. Still, due to the large primary school-age population in the region, this means that 7 million children are excluded from education.
The remaining regions have significantly fewer children out of school: Arab States (5.0 million), Latin America and the Caribbean (2.7 million), North America and Western Europe (1.3 million), Central and Eastern Europe (0.9 million), and Central Asia (0.3 million).
Figure 2: Global distribution of children of primary school age in and out of school, 2010

Distribution of children in and out of school, by region, 2010

Source: UNESCO Institute for Statistics, July 2012. - CA = Central Asia, CEE = Central and Eastern Europe, LAC = Latin America and the Caribbean, NAWE = North America and Western Europe. - Figure 2 was created with the spineplot add-on for Stata (Cox 2008). - Click image to enlarge.
Share:
All copyright reserved by Khondoker Hafizur Rahman. Powered by Blogger.

Total Pageviews

Search This Blog

My Blog List

Blogger news

About

Popular Posts

Pages